How do I read the Pass-Through Report graphs?
What is our passthrough rate for each stage?

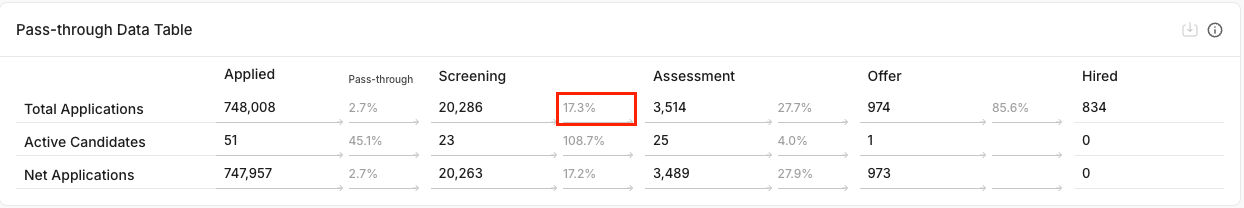
There is a small but important distinction when reading the graph in the report. If you see a pass-through rate of 17.3% at the Assessment stage, that means 17.3% of people from the Screening stage got to the Assessment stage. It does not mean that only 17.3% of people pass the Assessment stage.
In the chart you can think of it as an entry rate, not an exit rate for that stage.
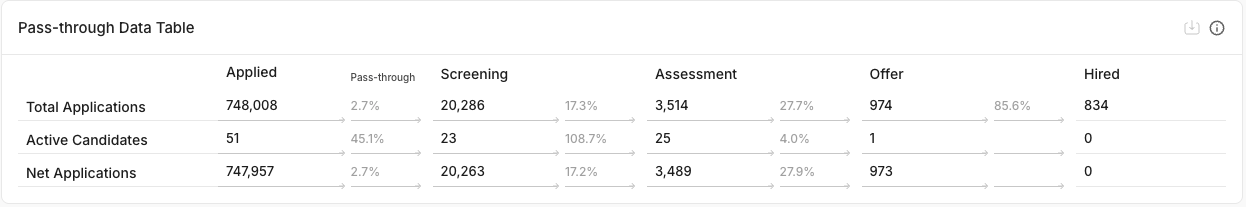
This relation is somewhat clearer in a table format, where you can see the rates of candidates passing between the stages. Same as in the graph, in this case 17.3% of people passed through to the Assessment stage.
Learn more about how pass-through rates are each stage are calculated here.
How many candidates do I need to get x hires?
This tool, which we refer to as a yield calculator, is intended to help project how many applicants are needed to reach your hiring goals.

We use pass-through rates from the date range selected in app to estimate how many candidates you will need at each stage of the process in order to get to the user-specified number of hires.
Enter the number of hires you are hoping to make to see an estimate of how many applicants you should attract (and how many screenings, assessments and offers extended you should conduct) in order to reach your goals. If the number of candidates you've had at each stage is below the estimate, it may signify that you could have difficulty making the desired number of hires.
How are the candidate estimates at each stage calculated?
The number of candidates needed at each stage in order to reach your hiring goals is calculated by using historical data from the date range chosen. We divide the number of candidates that have reached the given stage by the number of hires made in that date range.
candidates who reached a given stage
__________________________
candidates who were hired
For example, if historically (in the chosen date range) you assessed 3,514 candidates and made 834 hires, the estimated number to assessments you would need to conduct in the future to make one hire would be 3,514/834 or 4.2. Multiply that by the times the number of hires you want to make. So, for 5 hires you would need to do 4.2 x 5, or 21 assessments.
NOTE: The Yield Calculator rounds to the nearest whole number.
When the date range is too close to the present, there will be a disproportionately low number of hires because most candidates will not have been resolved yet. Therefore, the yield calculator will show incorrectly high numbers. We suggest using a time period at least one quarter removed from the present so that applicants have had the time to be resolved.