Explore Datapeople's Usage Report
The Usage Report shows which users are active in Datapeople and what actions they're taking.

The Usage Report provides insight into:
- how many users are utilizing Datapeople
- how many revisions they’ve made
- which jobs jobs they’ve edited
- what their average scores are
The Post Revisions graph has two views:
- one showing how the number of revisions by your users is associated with the average scores of your jobs
- one showing how the number of revisions, users, and posts edited have trended across the selected time frame selected int eh date filter
The Engagement table shows all users who were active during the selected time frame, sorted by highest average score. Click “View All” to expand the table and sort by lowest score, or by highest/lowest number of revisions or posts edited.

The report is:
- Filterable:
- If your organization doesn't have an ATS integration with Datapeople, you will see default Datapeople filters (i.e., user and location filters).
- If your organization does have an ATS integration, you will see standard filters from your ATS, in addition to default Datapeople filters (user and location filters).
- Non-Admin users will see only the jobs they have access to. Admins will see all jobs in the organization by default.
- Downloadable as a CSV that you can load into Google Sheets/Excel or your BI/dashboarding tool of choice.
-

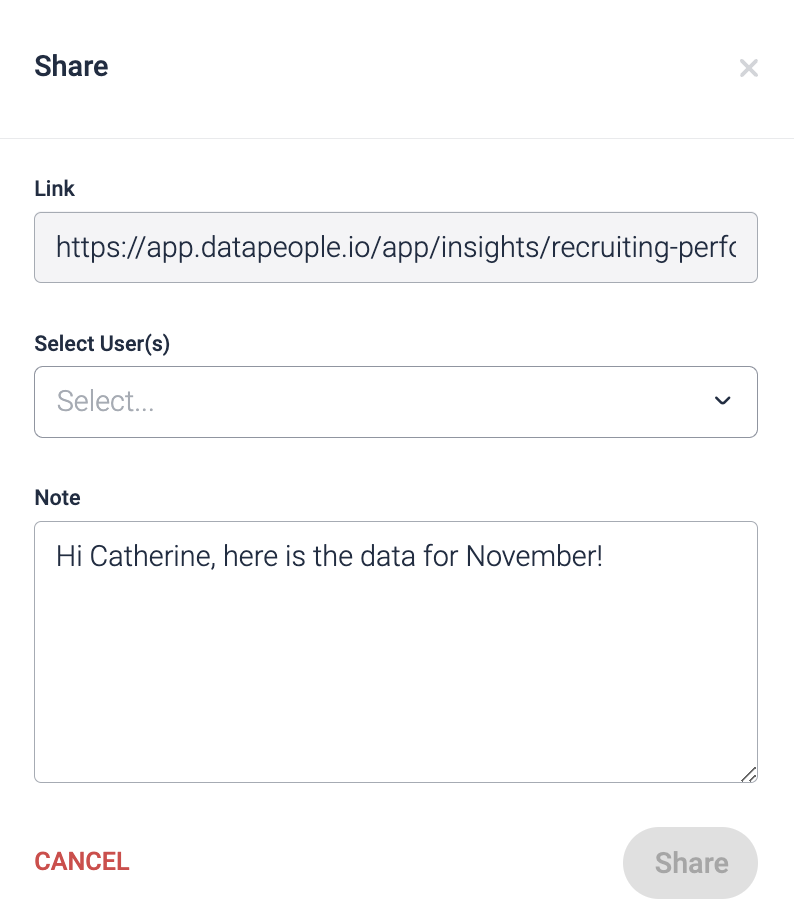
Download and Share Icons - Sharable with team members
- Select the job(s) using the check boxes
- Click the purple Share button at the top right of the jobs list
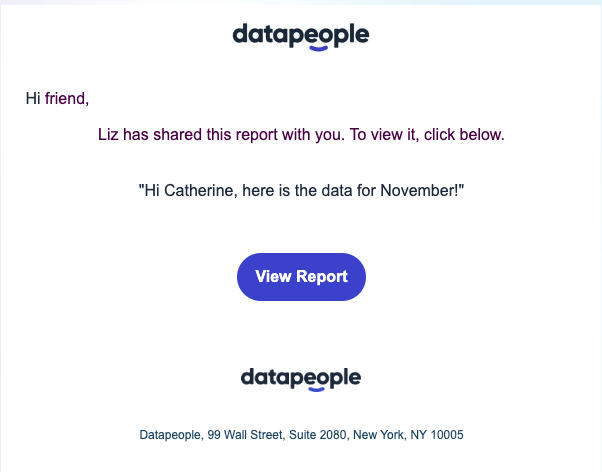
- Select a user to share the job(s) with and add an optional message. The selected user(s) will receive an email linking directly to the selected job(s):